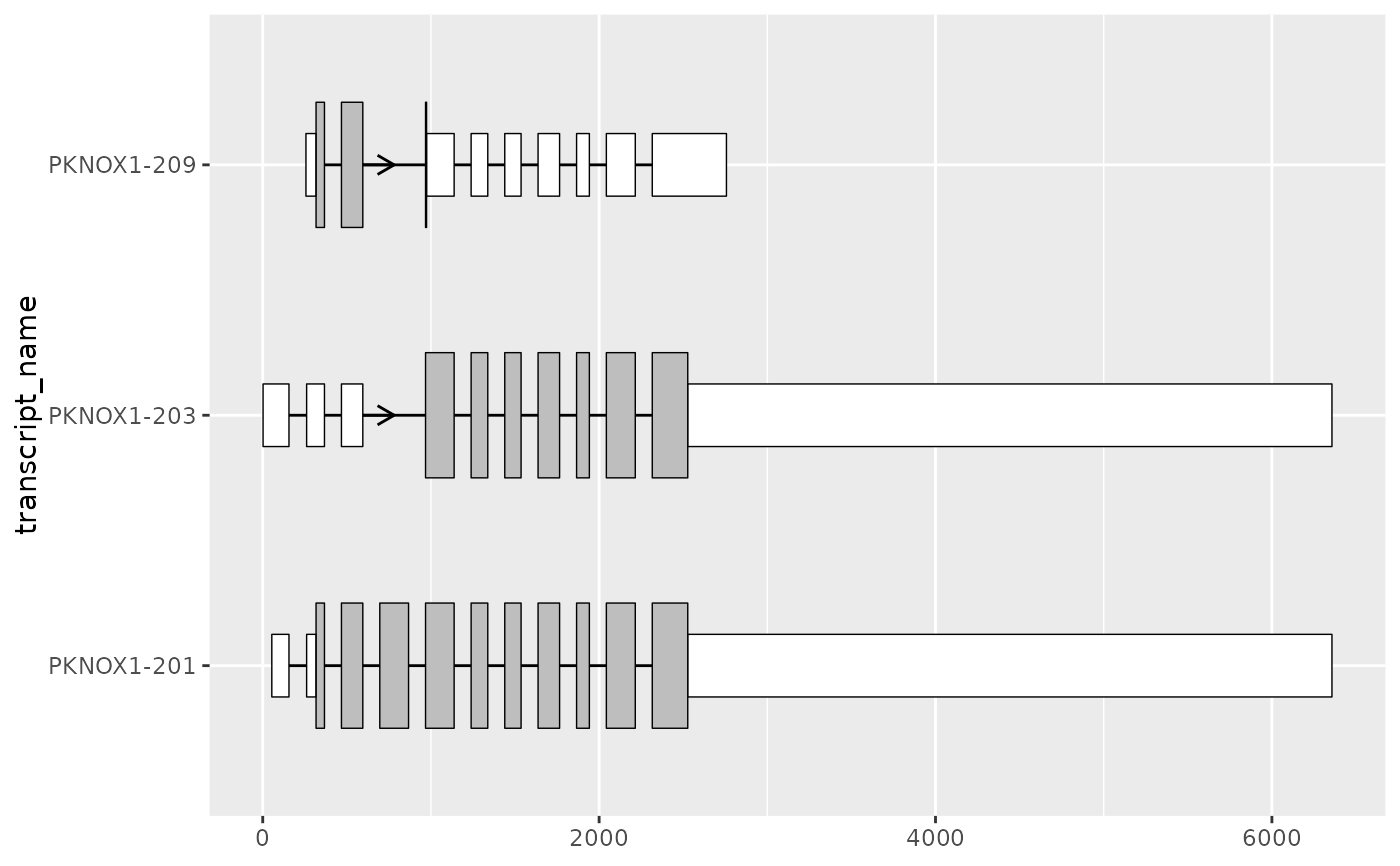
Given a set of exons (encompassing the CDS and UTRs) and cds regions,
add_utr() will calculate and add the corresponding UTR regions as ranges.
This can be useful when combined with shorten_gaps() to visualize
transcripts with long introns, whilst differentiating UTRs from CDS regions.
Arguments
- exons
data.frame()contains exons which can originate from multiple transcripts differentiated bygroup_var.- cds
data.frame()contains coding sequence ranges for the transcripts inexons.- group_var
character()if input data originates from more than 1 transcript,group_varmust specify the column that differentiates transcripts (e.g. "transcript_id").
Value
data.frame() contains differentiated CDS and UTR ranges.
Details
The definition of the inputted cds regions are expected to range from the
beginning of the start codon to the end of the stop codon. Sometimes, for
example in the case of Ensembl, reference annotation will omit the stop
codons from the CDS definition. In such cases, users should manually ensure
that the cds includes both the start and stop codons.
Examples
library(magrittr)
library(ggplot2)

# to illustrate the package's functionality
# ggtranscript includes example transcript annotation
pknox1_annotation %>% head()
#> # A tibble: 6 × 8
#>   seqnames    start      end strand type       gene_name transcript_name
#>   <fct>       <int>    <int> <fct>  <fct>      <chr>     <chr>
#> 1 21       42974510 43033931 +      gene       PKNOX1    NA
#> 2 21       42974510 43033931 +      transcript PKNOX1    PKNOX1-203
#> 3 21       42974510 42974664 +      exon       PKNOX1    PKNOX1-203
#> 4 21       43004326 43004432 +      exon       PKNOX1    PKNOX1-203
#> 5 21       43007491 43007618 +      exon       PKNOX1    PKNOX1-203
#> 6 21       43013068 43013238 +      exon       PKNOX1    PKNOX1-203
#> # ℹ 1 more variable: transcript_biotype <chr>

# extract exons
pknox1_exons <- pknox1_annotation %>% dplyr::filter(type == "exon")
pknox1_exons %>% head()
#> # A tibble: 6 × 8
#>   seqnames    start      end strand type  gene_name transcript_name
#>   <fct>       <int>    <int> <fct>  <fct> <chr>     <chr>
#> 1 21       42974510 42974664 +      exon  PKNOX1    PKNOX1-203
#> 2 21       43004326 43004432 +      exon  PKNOX1    PKNOX1-203
#> 3 21       43007491 43007618 +      exon  PKNOX1    PKNOX1-203
#> 4 21       43013068 43013238 +      exon  PKNOX1    PKNOX1-203
#> 5 21       43016908 43017007 +      exon  PKNOX1    PKNOX1-203
#> 6 21       43018133 43018230 +      exon  PKNOX1    PKNOX1-203
#> # ℹ 1 more variable: transcript_biotype <chr>

# extract cds
pknox1_cds <- pknox1_annotation %>% dplyr::filter(type == "CDS")
pknox1_cds %>% head()
#> # A tibble: 6 × 8
#>   seqnames    start      end strand type  gene_name transcript_name
#>   <fct>       <int>    <int> <fct>  <fct> <chr>     <chr>
#> 1 21       43013068 43013238 +      CDS   PKNOX1    PKNOX1-203
#> 2 21       43016908 43017007 +      CDS   PKNOX1    PKNOX1-203
#> 3 21       43018133 43018230 +      CDS   PKNOX1    PKNOX1-203
#> 4 21       43021303 43021431 +      CDS   PKNOX1    PKNOX1-203
#> 5 21       43024871 43024947 +      CDS   PKNOX1    PKNOX1-203
#> 6 21       43028702 43028874 +      CDS   PKNOX1    PKNOX1-203
#> # ℹ 1 more variable: transcript_biotype <chr>

# the CDS definition originating from the Ensembl reference annotation
# does not include the stop codon
# we must incorporate the stop codons into the CDS manually
# by adding 3 base pairs to the end of the CDS of each transcript
pknox1_cds_w_stop <- pknox1_cds %>%
    dplyr::group_by(transcript_name) %>%
    dplyr::mutate(
        end = ifelse(end == max(end), end + 3, end)
    ) %>%
    dplyr::ungroup()

# add_utr() adds ranges that represent the UTRs
pknox1_cds_utr <- add_utr(
    pknox1_exons,
    pknox1_cds_w_stop,
    group_var = "transcript_name"
)

pknox1_cds_utr %>% head()
#> # A tibble: 6 × 9
#>   seqnames    start      end width strand transcript_name type  gene_name
#>   <fct>       <int>    <int> <int> <fct>  <chr>           <chr> <chr>
#> 1 21       42974510 42974664   155 +      PKNOX1-203      UTR   NA
#> 2 21       43004326 43004432   107 +      PKNOX1-203      UTR   NA
#> 3 21       43007491 43007618   128 +      PKNOX1-203      UTR   NA
#> 4 21       43013068 43013238   171 +      PKNOX1-203      CDS   PKNOX1
#> 5 21       43016908 43017007   100 +      PKNOX1-203      CDS   PKNOX1
#> 6 21       43018133 43018230    98 +      PKNOX1-203      CDS   PKNOX1
#> # ℹ 1 more variable: transcript_biotype <chr>

# this can be useful when combined with shorten_gaps()
# to visualize transcripts with long introns whilst differentiating UTRs
pknox1_cds_utr_rescaled <-
    shorten_gaps(
        exons = pknox1_cds_utr,
        introns = to_intron(pknox1_cds_utr, "transcript_name"),
        group_var = "transcript_name"
    )

pknox1_cds_utr_rescaled %>%
    dplyr::filter(type == "CDS") %>%
    ggplot(aes(
        xstart = start,
        xend = end,
        y = transcript_name
    )) +
    geom_range() +
    geom_range(
        data = pknox1_cds_utr_rescaled %>% dplyr::filter(type == "UTR"),
        height = 0.25,
        fill = "white"
    ) +
    geom_intron(
        data = to_intron(
            pknox1_cds_utr_rescaled %>% dplyr::filter(type != "intron"),
            "transcript_name"
        ),
        arrow.min.intron.length = 110
    )
