add_exon_number() adds the exon number (the order the exons are transcribed
within each transcript) as a column in exons. This can be useful when
visualizing long, complex transcript structures, in order to keep track of
specific exons of interest.
Arguments
- exons
data.frame()contains exons which can originate from multiple transcripts differentiated bygroup_var.- group_var
character()if input data originates from more than 1 transcript,group_varmust specify the column that differentiates transcripts (e.g. "transcript_id").
Value
data.frame() equivalent to input exons, with the additional
column "exon_number".
Details
To note, a "strand" column must be present within exons. The strand is used
to differentiate whether exon numbers should be calculated according to
ascending ("+") or descending ("-") genomic co-ordinates. For ambiguous
strands ("*"), add_exon_number() will be assume the strand be "+".
Examples
library(magrittr)
library(ggplot2)
# to illustrate the package's functionality
# ggtranscript includes example transcript annotation
sod1_annotation %>% head()
#> # A tibble: 6 × 8
#> seqnames start end strand type gene_name transcript_name
#> <fct> <int> <int> <fct> <fct> <chr> <chr>
#> 1 21 31659666 31668931 + gene SOD1 NA
#> 2 21 31659666 31668931 + transcript SOD1 SOD1-202
#> 3 21 31659666 31659784 + exon SOD1 SOD1-202
#> 4 21 31659770 31659784 + CDS SOD1 SOD1-202
#> 5 21 31659770 31659772 + start_codon SOD1 SOD1-202
#> 6 21 31663790 31663886 + exon SOD1 SOD1-202
#> # ℹ 1 more variable: transcript_biotype <chr>
# extract exons
sod1_exons <- sod1_annotation %>% dplyr::filter(type == "exon")
sod1_exons %>% head()
#> # A tibble: 6 × 8
#> seqnames start end strand type gene_name transcript_name
#> <fct> <int> <int> <fct> <fct> <chr> <chr>
#> 1 21 31659666 31659784 + exon SOD1 SOD1-202
#> 2 21 31663790 31663886 + exon SOD1 SOD1-202
#> 3 21 31666449 31666518 + exon SOD1 SOD1-202
#> 4 21 31667258 31667375 + exon SOD1 SOD1-202
#> 5 21 31668471 31668931 + exon SOD1 SOD1-202
#> 6 21 31659693 31659841 + exon SOD1 SOD1-204
#> # ℹ 1 more variable: transcript_biotype <chr>
# add the exon number for each transcript
sod1_exons <- sod1_exons %>% add_exon_number(group_var = "transcript_name")
base <- sod1_exons %>%
ggplot(aes(
xstart = start,
xend = end,
y = transcript_name
)) +
geom_range() +
geom_intron(
data = to_intron(sod1_exons, "transcript_name"),
strand = "+"
)
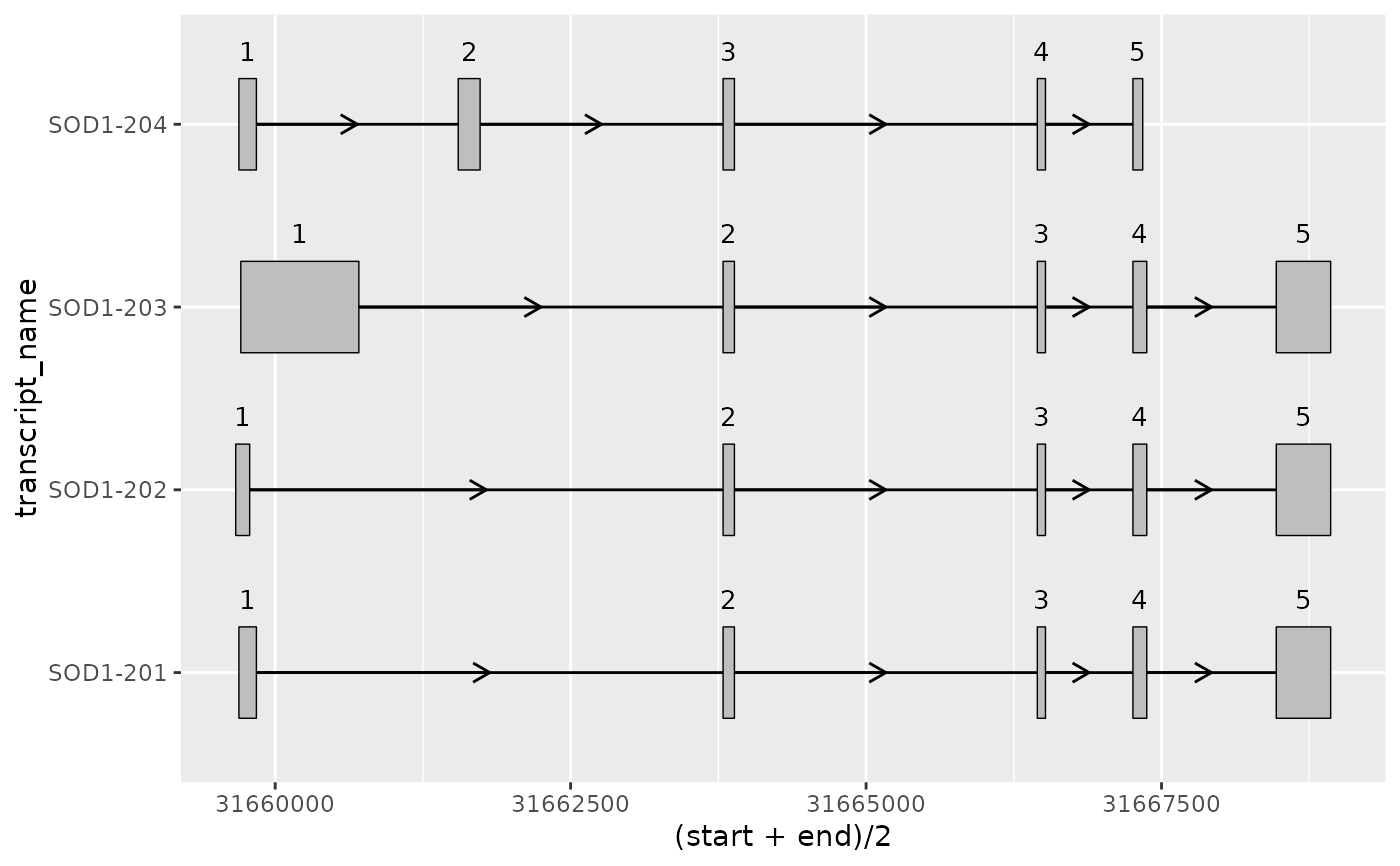
# it can be useful to annotate exons with their exon number
# using ggplot2::geom_text()
base +
geom_text(aes(
x = (start + end) / 2, # plot label at midpoint of exon
label = exon_number
),
size = 3.5,
nudge_y = 0.4
)
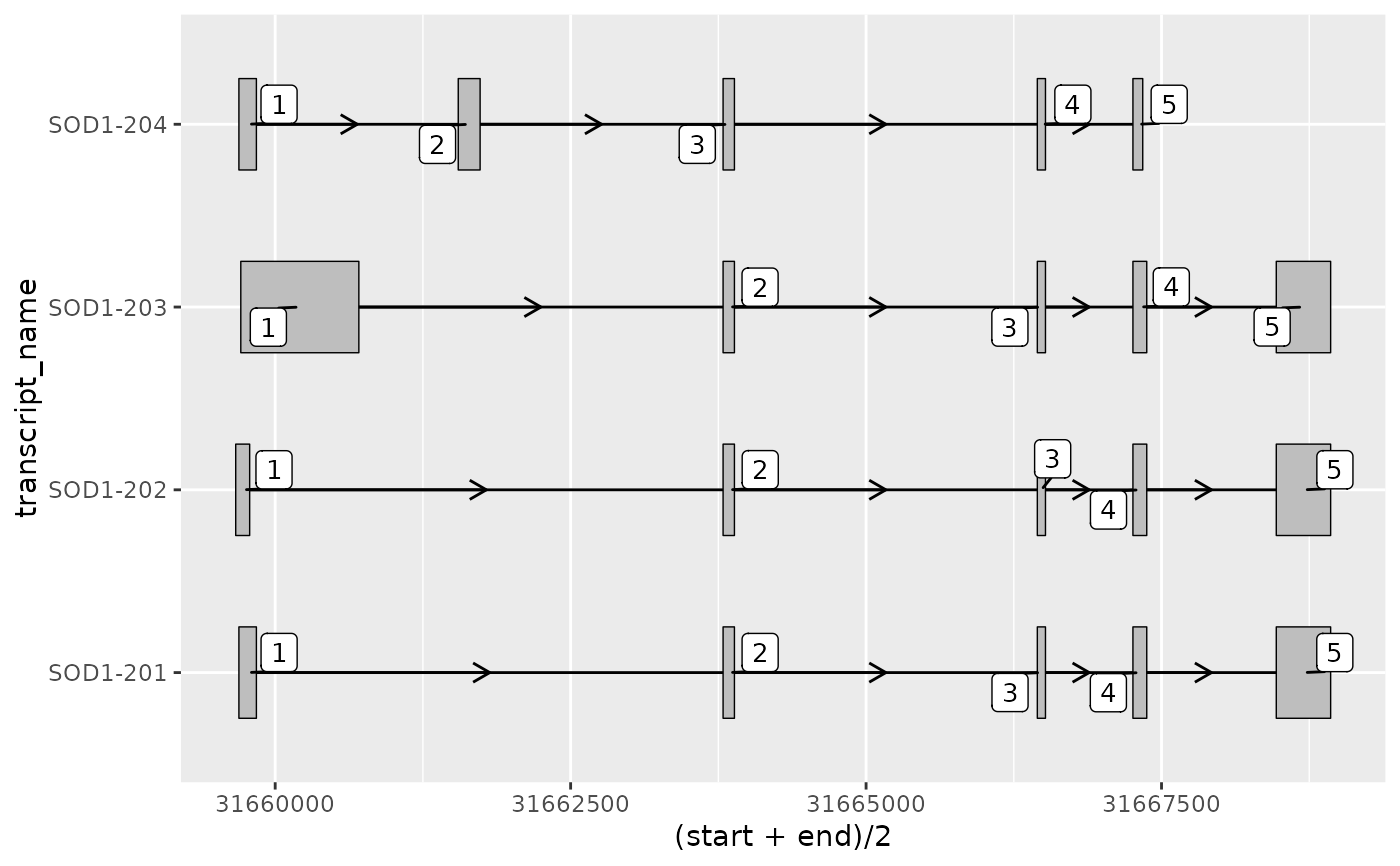
 # Or alternatively, using ggrepel::geom_label_repel()
# to separate labels from exons
base +
ggrepel::geom_label_repel(ggplot2::aes(
x = (start + end) / 2,
label = exon_number
),
size = 3.5,
min.segment.length = 0
)
# Or alternatively, using ggrepel::geom_label_repel()
# to separate labels from exons
base +
ggrepel::geom_label_repel(ggplot2::aes(
x = (start + end) / 2,
label = exon_number
),
size = 3.5,
min.segment.length = 0
)